How to Debug Like a Pro
Debugging techniques you should be aware of as a web developer.
Being a web developer one must be aware of some awesome debugging techniques. To be honest, I have been using console.log() along with a debugger to debug my code, but debugging is not limited to these two. I have come across some great articles informing there is so much more. Now I use a combination of many techniques which I have explained below, and believe me my life has become easier 😇
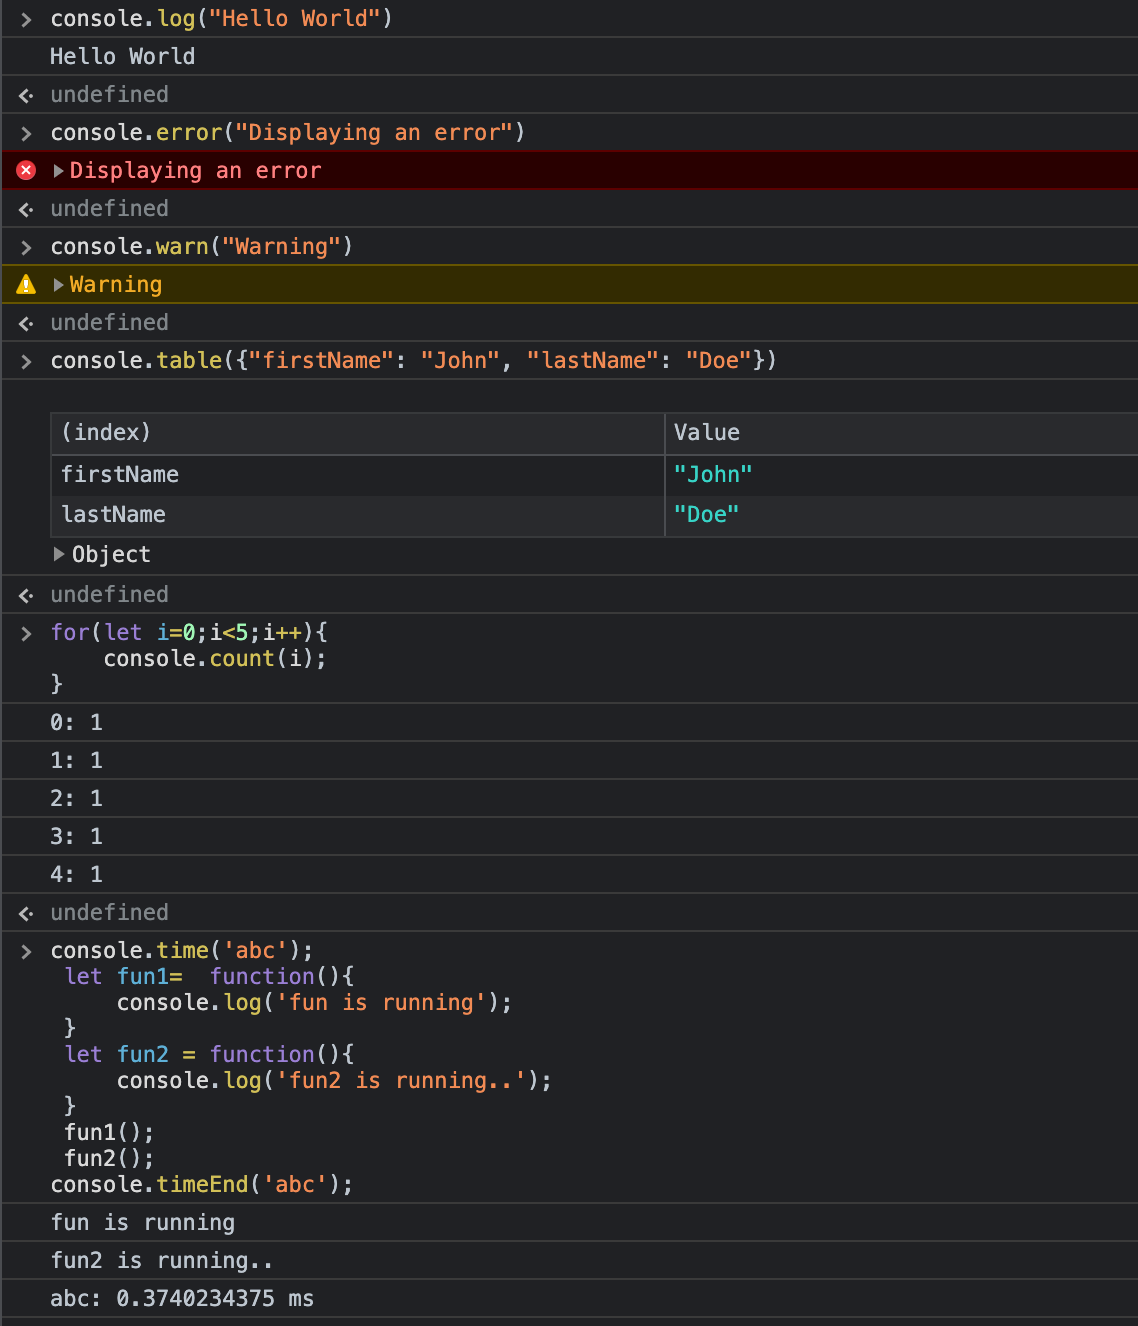
Let’s start with showing a message in the console:
log()
error()
warn()
table()
count()
time() and timeEnd()
Few keyboard shortcuts that come handy
To clear console ctrl L*(Windows) or **cmd K(**Mac OS)*
Show console ctrl `
While inspecting an element, select the element and press f2 to Edit as HTML
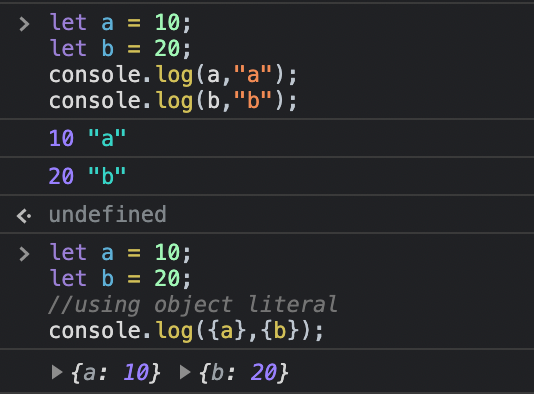
While logging multiple variables, keeping track of individual variables can become difficult. Either we have to write them with a different console.log() or give them specific strings.
Using an object literal comes in handy here.
Few Developer tools settings which I personally use
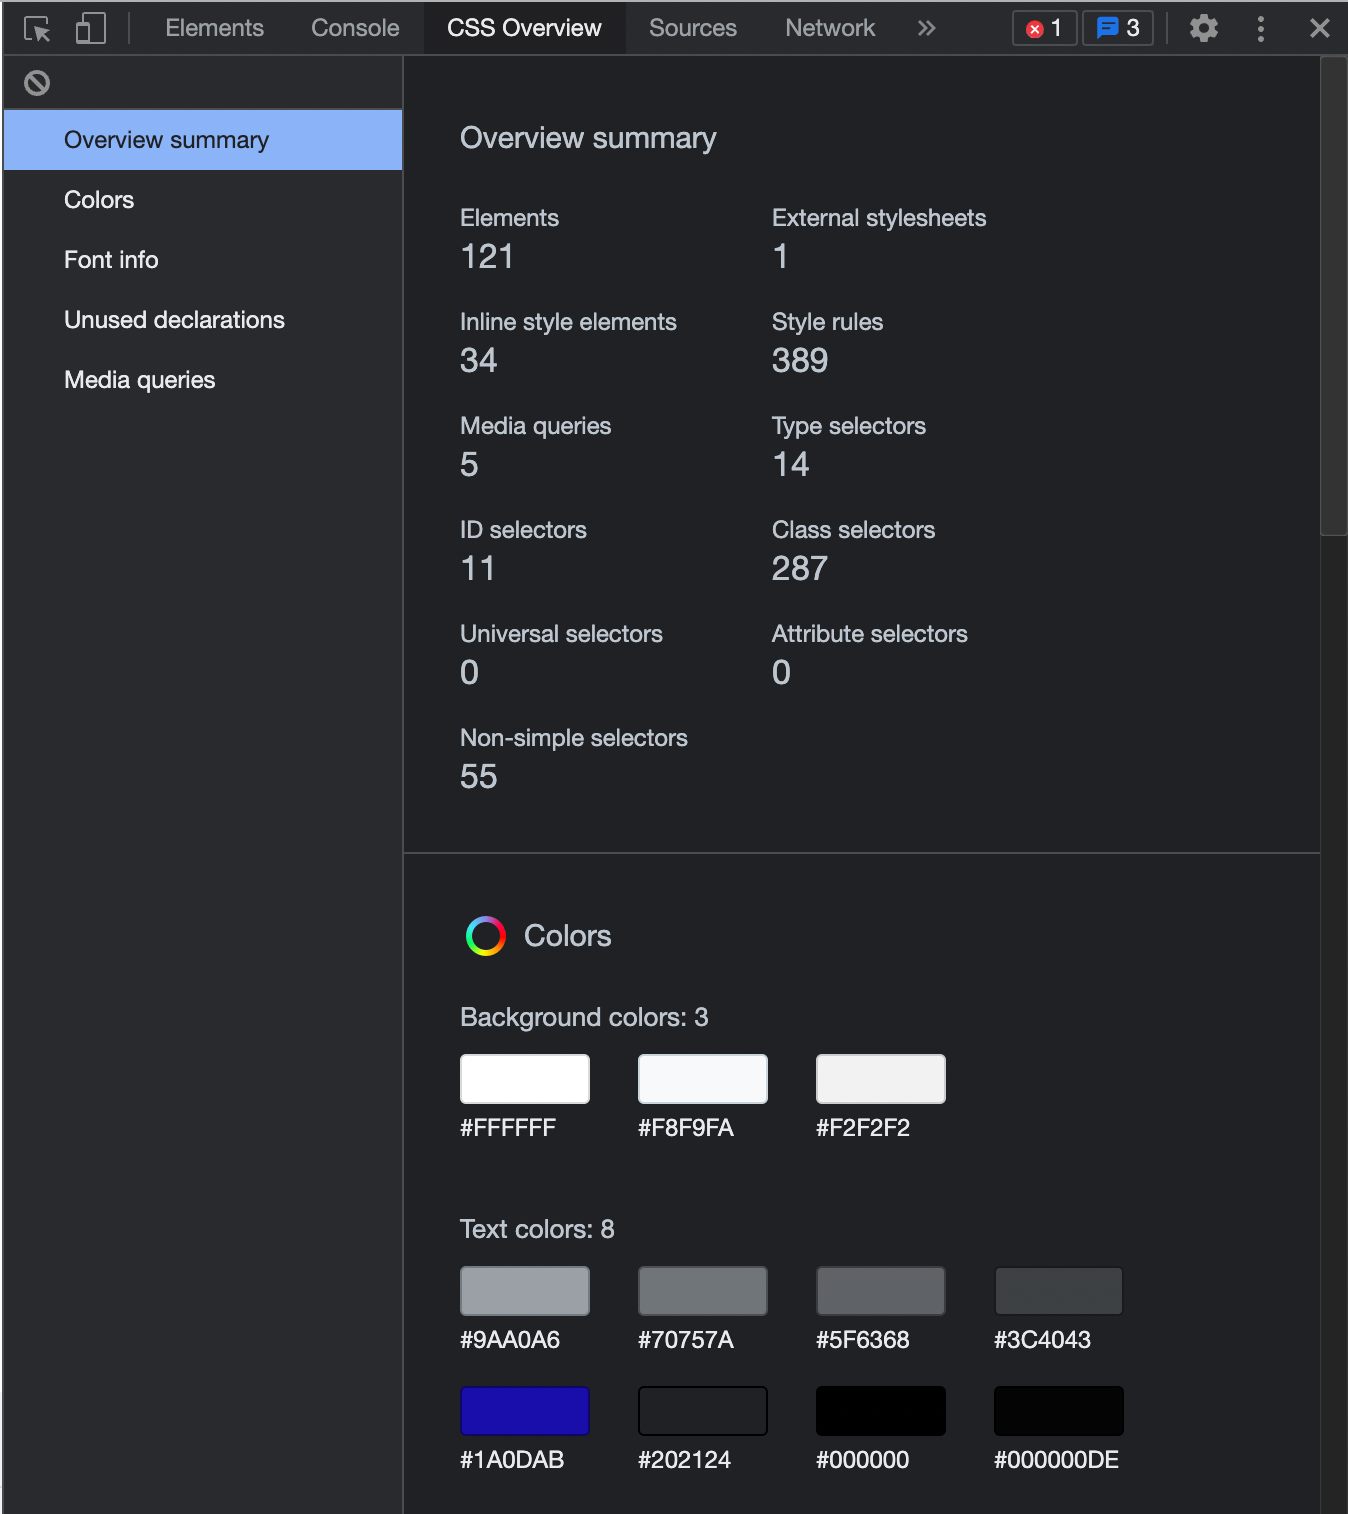
CSS Overview — This will show the summary of all the colors, fonts, and media queries in one place.
On Google Chrome, open Developer Tools*.*
Open Settings.
Click on Experiments Tab.
Enable the CSS Overview.
Reload the DevTools.
A new tab will appear in DevTools as CSS Overview.
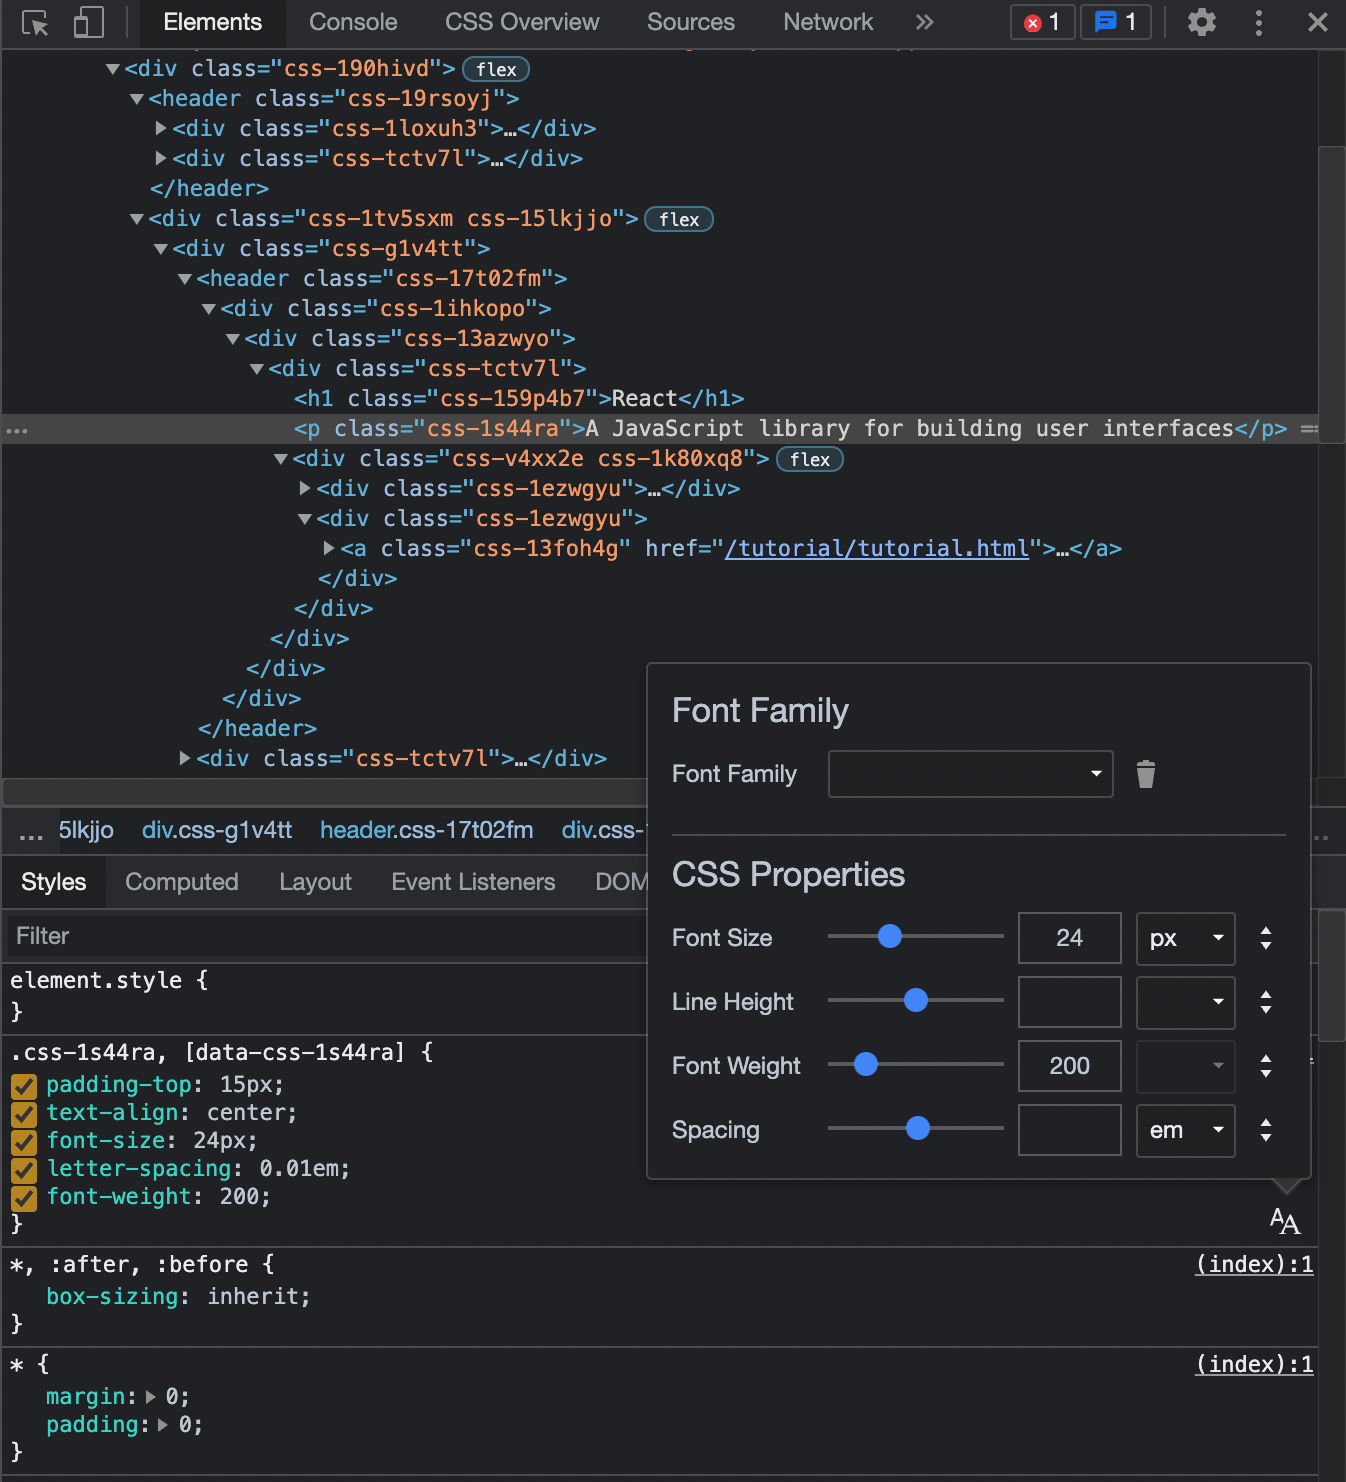
Font editor tools — This feature lets us try different fonts without writing a single line of code.
Go to Experiments Tab through Chrome DevTools.
Check Enable New Font Editor Tools within Styles Pane.
Reload the DevTools.
Select the HTML element, which includes the font properties you want to change.
You will notice the Font Editor icon in the Styles pane.
Few shortcuts which I always use
Get the currently selected tagGo to chrome dev tools and type $0 in the console. This will give the reference to the currently selected node.
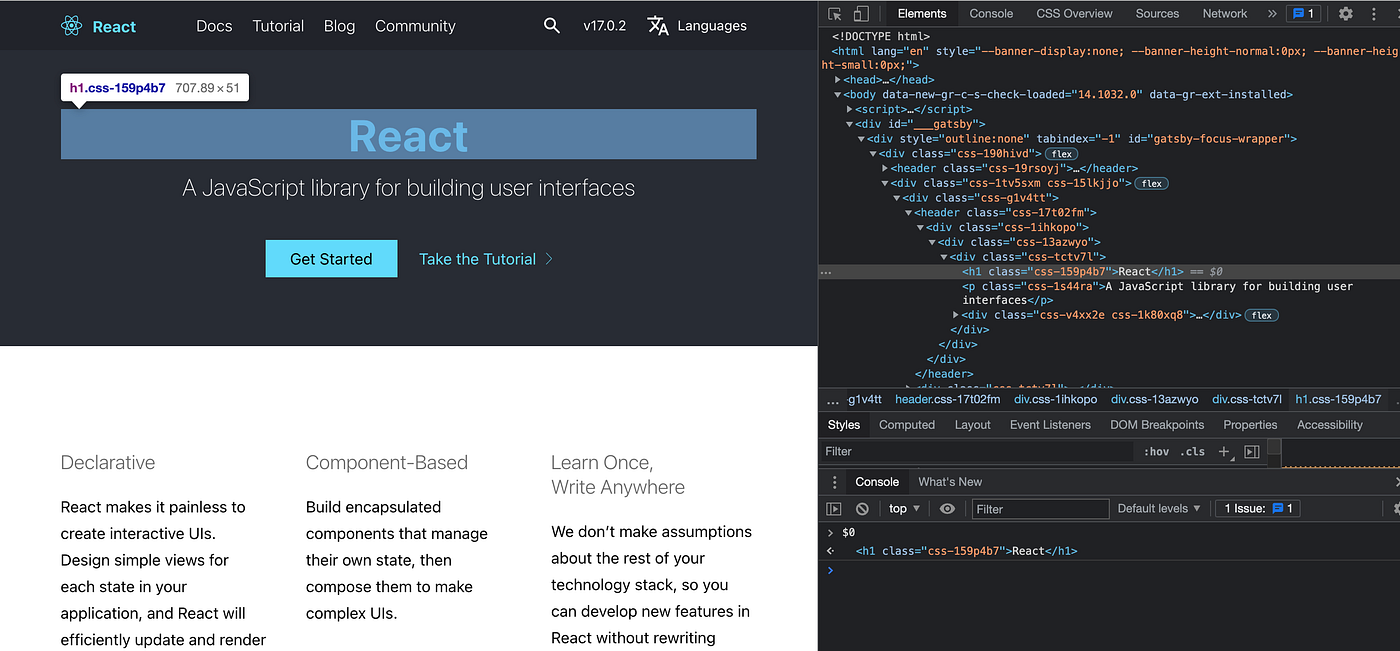
Get the last evaluated value in the console Go to chrome dev tools and type $_ in the console. This will always print the last evaluated value.

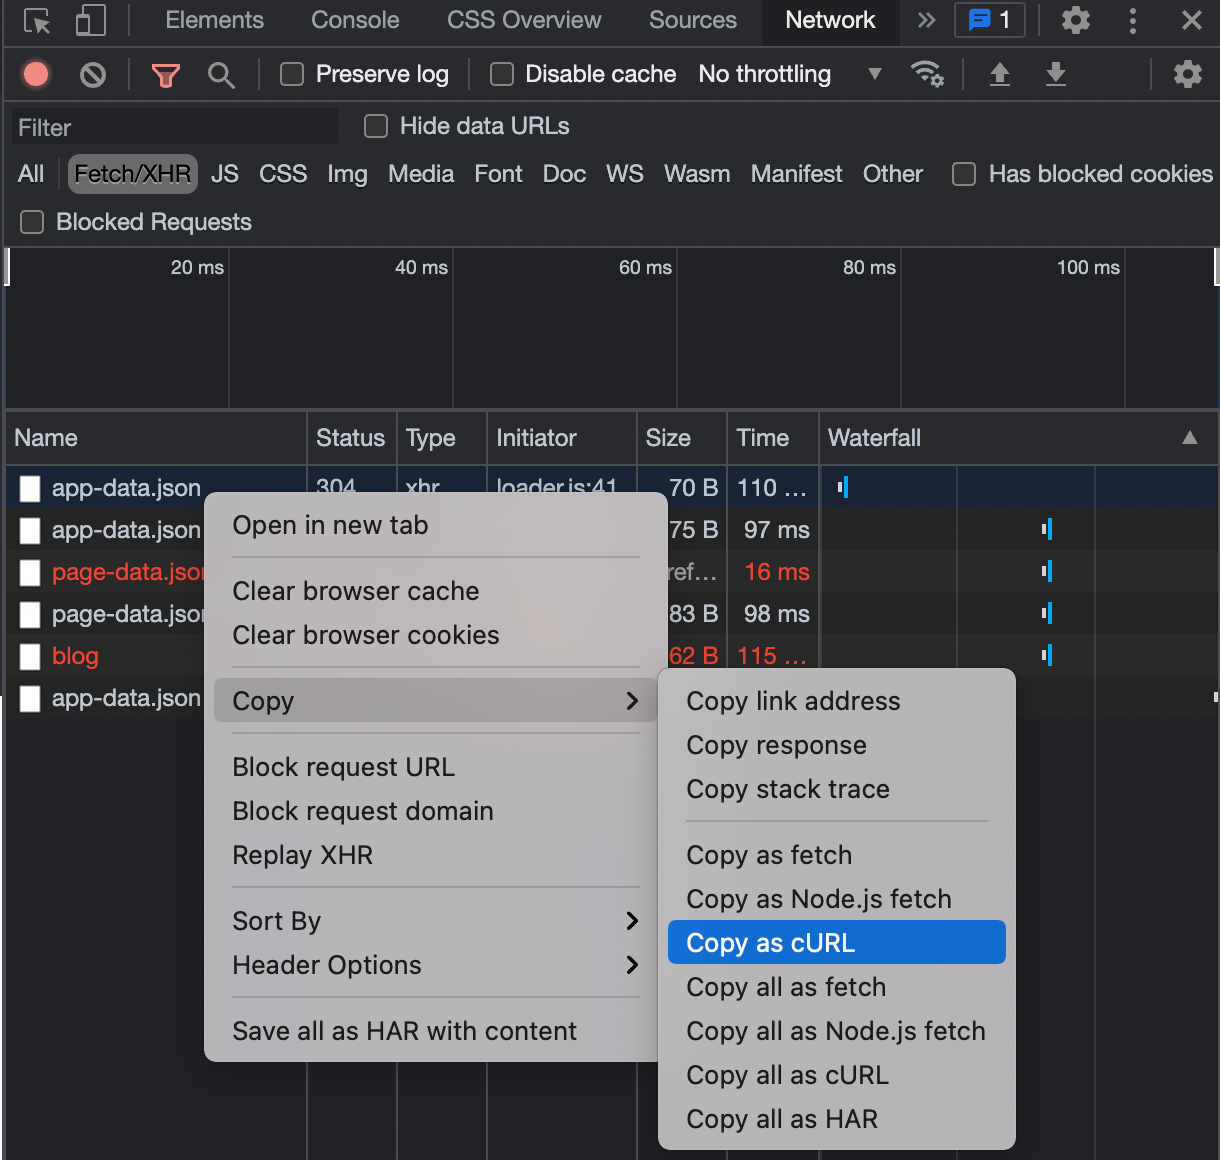
Copy the request as cURL from the network tab Directly copy the request as a cURL from the network tab.
Edit the whole page by turning designMode to on
Go to chrome dev tools and type document.designMode=”on”. This will let you modify it without refreshing the page.
I hope this has helped you as it has helped me.
In case I have missed something or you have some advice or suggestions do let me know in the comment section.
You can also reach out to me at
https://www.linkedin.com/in/akhatun/
https://www.instagram.com/readwithamnah/
https://twitter.com/KhatunAmnah
https://readwithamnah.blogspot.com/
Happy coding✌️
